Language: English
pre-released data of the IPCC-2021 Report
“Climate Change 2021 - The Physical Science Basis”
This data was not meant to be released yet (accepted version, subject to final editing). Nonetheless it may give you a glimpse of what you can expect from the IPCC-2021 report. Here is a list of the graphics I have found interesting:
- natural variability of temperature of ±0.23°C, see page 926
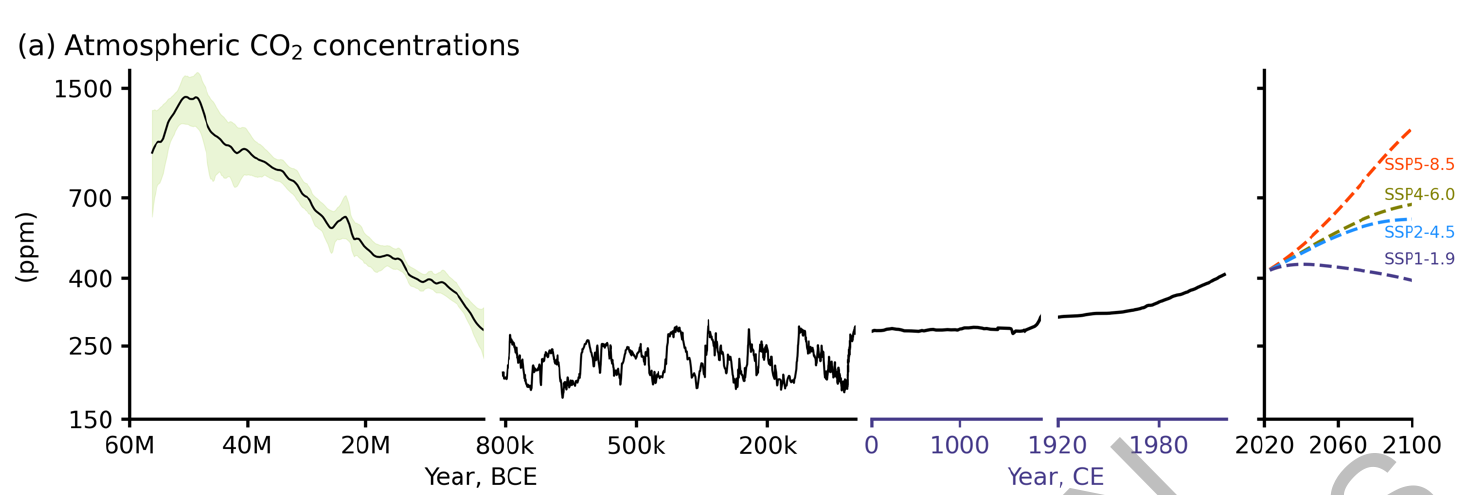
- CO2 levels up to 60 million years back, page 1331
- splitting into economic sectors and kinds of GHG, combined into one graphic, page 1555
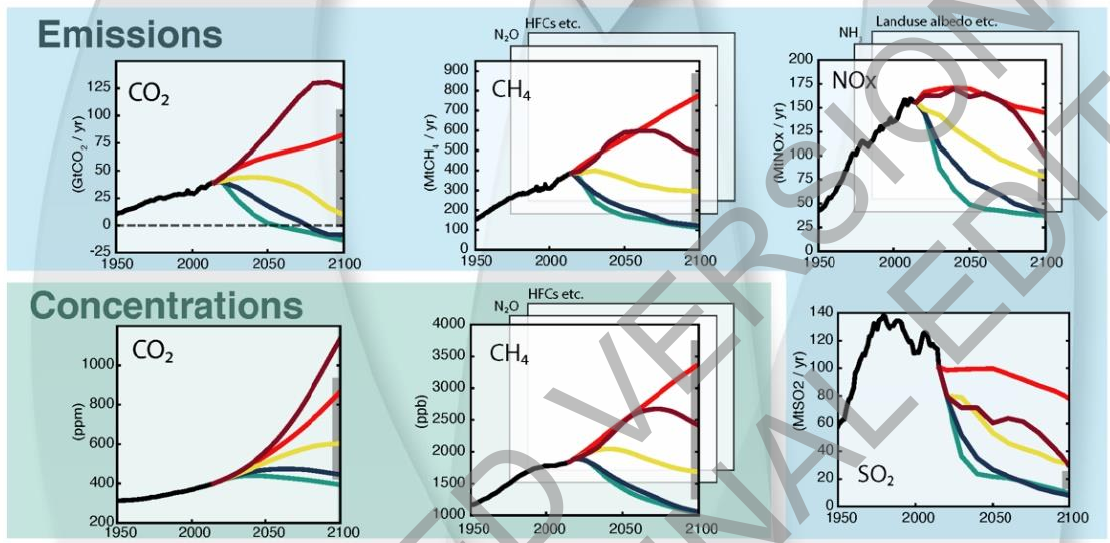
- CO2, CH4, NOx, SO2 emissions from recent and future years for different scenarios in different colours, page 149
- global ocean heat content, page 905
- halogenes, page 605
- https://www.ipcc.ch/report/sixth-assessment-report-cycle/
- full report: Climate Change 2021 - The Physical Science Basis

